
2025 Outlook: Global rates and local optimism – neither are certain
The formation of the government of national unity (GNU) in May 2024 saw South African assets outperform emerging market peers last year and current valuations are pinned to the GNU delivering some measure of structural reform during 2025.
Domestic optimism is ripe for at least some degree of caution. Globally, US data currently provides little in the way of conclusive evidence about the likely path ahead for growth, inflation and interest rates. And, combined with the unpredictability of the newly elected US president, it is reasonable to expect that markets will be volatile and at times priced for extreme scenarios. Against this backdrop we attempt to chart a path for SA rates and the rand.
In the first half of 2025 we expect South Africa’s domestic narrative to remain positive but pitted against a difficult global backdrop for emerging markets. We expect some disappointment from South Africa’s upcoming February budget with respect to state-owned enterprise (SOE) bailouts and increased spending on wages and debt service costs, which will weigh on the longer end of the curve. Shorter-dated bonds should respond positively to contained local inflation and moderation in front-end US rates in the second half of the year.
US monetary policy is too tight
Post Trump being elected as president and the associated tariff and fiscal expansion promises, US inflation expectations have risen, and rate cut expectations have fallen, reducing appetite for emerging markets assets. The December Federal Open Market Committee (FOMC) dot plot signalled median expectations were for the fed funds rate (FFR) to end 2025 50 basis points (bp) lower at 4.0%, 2026 at 3.75% and 2027 at 3.25%. The FOMC also raised its estimate of the real neutral rate from 0.75% to 1.0%. Interest rate derivatives expect the rate-cutting cycle to be truncated at close to current levels (Figure 2). This more hawkish outlook prompted US and EM bonds to sell off.
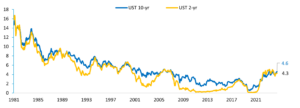
Expectations of a US recession have receded and the US yield curve, which was inverted for most of 2024, has normalised. Historically, the yield curve normalises in response to the US Federal Reserve Bank (Fed) cutting rates, causing the 2-yr yield to fall faster than the 10-yr yield (Figure 1). The spread between these two bonds tends to widen to 200bp at the peak of the cycle. However, the current cycle is unusual. Curve normalisation is being led by the US 10-yr yield rising, not by the 2-yr falling. This indicates that markets are priced for a relatively unusual and potentially extreme scenario:
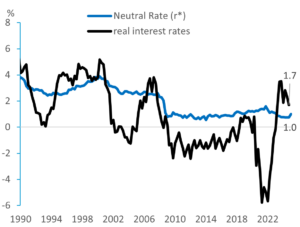
- The real US policy rate is extremely tight against its historical average (Figure 3). Usually in a cutting cycle, the real FFR falls well below neutral, to zero or into negative territory. Currently the real rate is 1.7% and is 70bp above neutral.
- With 2-yr bond yields in line with the FFR (4.3%), to achieve a 200bp spread to the 10-yr without the 2-yr moving lower implies the 10-yr at over 6.0%. Given current US debt levels this would be a fiscal dilemma and would put a domestic growth recovery under significant pressure, not to mention the effect on equities. The Fed would cut in response.
If, as we expect, the US cuts rates by more than the 3.9% currently priced (Figure 2), SA will be able to cut below the 7.50% currently priced by the market. This should favour a bull steepening in the SA curve, led by the front end falling by more than the back end.
Figure 1: US 2-year and 10-year Treasury yields
Source: Bloomberg, Matrix
Figure 2: Implied market expectations of the Fed Funds Rate (FFR)
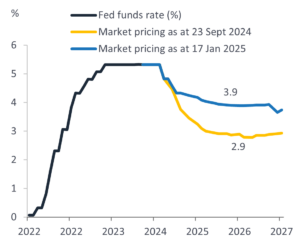
Figure 3: Real Fed Funds Rate versus the neutral rate*
Source: Bloomberg, NY Federal Reserve Bank, Matrix
Risks to SA bonds in 2025 are fiscal
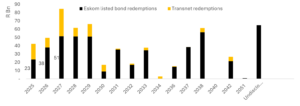
Transnet, joined by the ANC, is insistent that National Treasury (NT) provide it with an Eskom-style bailout. The R47bn guarantee facility the utility was granted in December 2023 is fully allocated and over the next three years Transnet’s debt-related spending amounts to an estimated R100bn (redemptions of R63bn and debt service costs of approximately R1bn per month) (Figure 4). Transnet, which has total debt of R138bn, has reportedly requested R61bn of debt restructuring and an equity injection of around R50bn. We expect that NT may grant additional guarantees to Transnet of R60bn in the 2025 budget, but that an equity injection will be delayed.
Furthermore, NT will be under pressure to increase Eskom’s bailouts due to municipal arears, which have been rising exponentially and now total R109bn. Local government non-payment is exacerbating Eskom’s financial position, impeding its ability to unbundle and better apportion its total debt, which amounts to R507bn (only R174bn of which is covered by the debt relief package).
We expect clarity in the upcoming budget about which Eskom bonds will form part of the budgeted R70bn Eskom-for-sovereign debt swap. It is likely that Eskom will want to include the ES26 (R38bn), which matures in April 2026. However, from NT’s perspective such a short-term redemption leaves Eskom with a long road of debt ahead.
Risks to the budget could also come from higher spending on the wage bill and debt service costs, if history is anything to go by. The 2023 and 2024 budgets increased the wage bill by R87bn and R145bn respectively over the Medium‐Term Expenditure Framework (MTEF, which refers to the cumulative 3-yr budget period). Debt service costs were revised higher by R135bn and R103bn in 2023 and 2024. Basic education is facing a R28.7bn shortfall in 2024/25, the SANDF is underfunded, and the border management authority (BMA) is looking for R4.5bn. Healthcare spending may also need to rise, depending on diplomatic relations between SA and the US, as the US revises its aid programme.
Figure 4: Eskom and Transnet’s redemption profile
Source: Bloomberg, National Treasury, Matrix
Figure 5: Precedent set in the previous two budgets around increased spending on wages and debt service costs over the MTEF
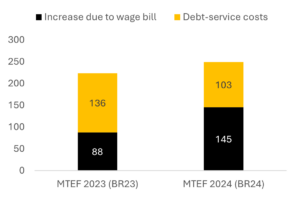
Figure 6: Debt service costs as % of revenue increased again in MTBPS24

Source: National Treasury, Matrix
SA bond fair value
Post the GNU rally, much of which was funded by offshore investors who bought 30% of net issuance or R80bn in 2024, the SA 10-yr bond is trading around 60bp expensive to our fair value model.
SA’s outperformance should also be viewed in the context of Brazil’s fiscal deterioration, and a general dearth of good-news EM reform stories. Looking ahead, we bear in mind that it is largely a hope-driven rally. For bonds to outperform peers from here, sentiment needs to materialise into actual GDP growth together with reduced fiscal risks. As the recent fracture around land expropriation has shown, any cracks in the GNU’s façade will reduce appetite by offshore investors.
According to our statistical analysis, the SA 5-yr bond is less sensitive to offshore uncertainties and SA’s fiscal metrics and more reliant on domestic rates and inflation, factors which we expect to be bond positive. Longer-dated bonds by their nature need to provide investors with additional yield to compensate for uncertainties surrounding the future of a country’s sovereign risk, which embodies its political, fiscal, inflation and growth risks.
Dollar to remain structurally strong in 1H2025
The US macro and geopolitical backdrop is characterised by a high degree of uncertainty, which buoys the safe haven status of US bonds and the dollar. Also supportive of the dollar are market expectations of higher US rates and inflation versus the EU.
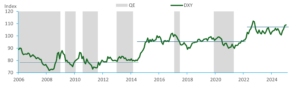
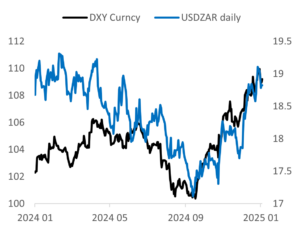
However, while we agree that the dollar should remain strong in the first half of 2025 the currency’s safe haven status may come under renewed scrutiny in the second half of the year as the US’s sovereign risk increases, President Trump embraces crypto and central banks increasingly shift out of US denominated FX reserves. Additionally, the dollar is high relative to history which should weigh on its ability to rally from here (Figure 7), and it is overvalued relative to its historic relationship with the US/EU real interest rate differential (Figure 8), which implies that uncertainty is a large part of current strength. If US rates fall more than the market anticipates, it is likely the dollar will fall back towards the midpoint of its current trading range. In this scenario, the rand will trade around a mid-point of 18.00 i.e. between 17.50 and 18.50. If the dollar remains where it is, expect the rand to trade around 19.00 by year end.
Figure 7: Dollar structurally high
Source: Bloomberg, Matrix
Figure 8: Dollar is driven by US/EU real rate differential and
its safe-haven status
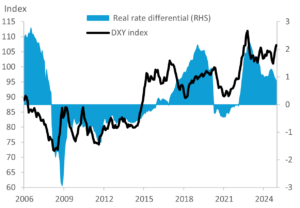
Figure 9: ZAR driven by GNU hopes and the dollar
Source: Bloomberg, Matrix
SA inflation faces structural as opposed to cyclical risks
Domestic inflation risks are not insignificant, but don’t appear imminent. Apart from the strong dollar/weak rand, there is pressure from regulated prices, particularly utilities (approx. 6.25% basket weight) and education (2.6% basket weight). According to the Federation of Governing Bodies of South African Schools (Fedsas) less than 3,000 of South Africa’s 22,511 public schools were fee-paying in 2024. And, due to tighter financial conditions and consumer distress, fee-paying schools may need to subsidise fee exemptions of between R7.4bn and R10.8bn in 2025. Ultimately this has fiscal implications but also affects education inflation. Some former Model C schools have announced an increase in fees for this year of between 6.8% and 7.9%. Higher school fees are, in turn, driven by escalating expenses for utilities.
Private sector participation in fixing eroded infrastructure at a municipal and national level means that fiscal infrastructure spending is being replaced by a user-pays model; what was paid for by taxes will be paid for by tariffs and will keep inflation higher than otherwise would be the case.
SA growth, is this the year?
South African and offshore investors have long been aware that the root cause of SA’s structural devaluation is slow growth. 2025 is expected to provide hope that this tide is turning. Due to long-term local government dysfunction, larger metros are increasingly the engines of growth; Johannesburg (15% of GDP), Cape Town (10%) and eThekwini (9.5%) account for 35% of GDP and South Africa’s future is tied to their fate.
We caution that while we think the GNU will remain intact, lack of political will to privatise remains, especially at sub-national level, and will stall the reform process; patience may still be required. Over the past decade, South Africa’s average annual real GDP growth rate has been 0.8% per annum, which is lower than population growth of between 1.2% and 1.6%. Wealth has been eroded alongside potential GDP and there is much to repair and rebuild.
